
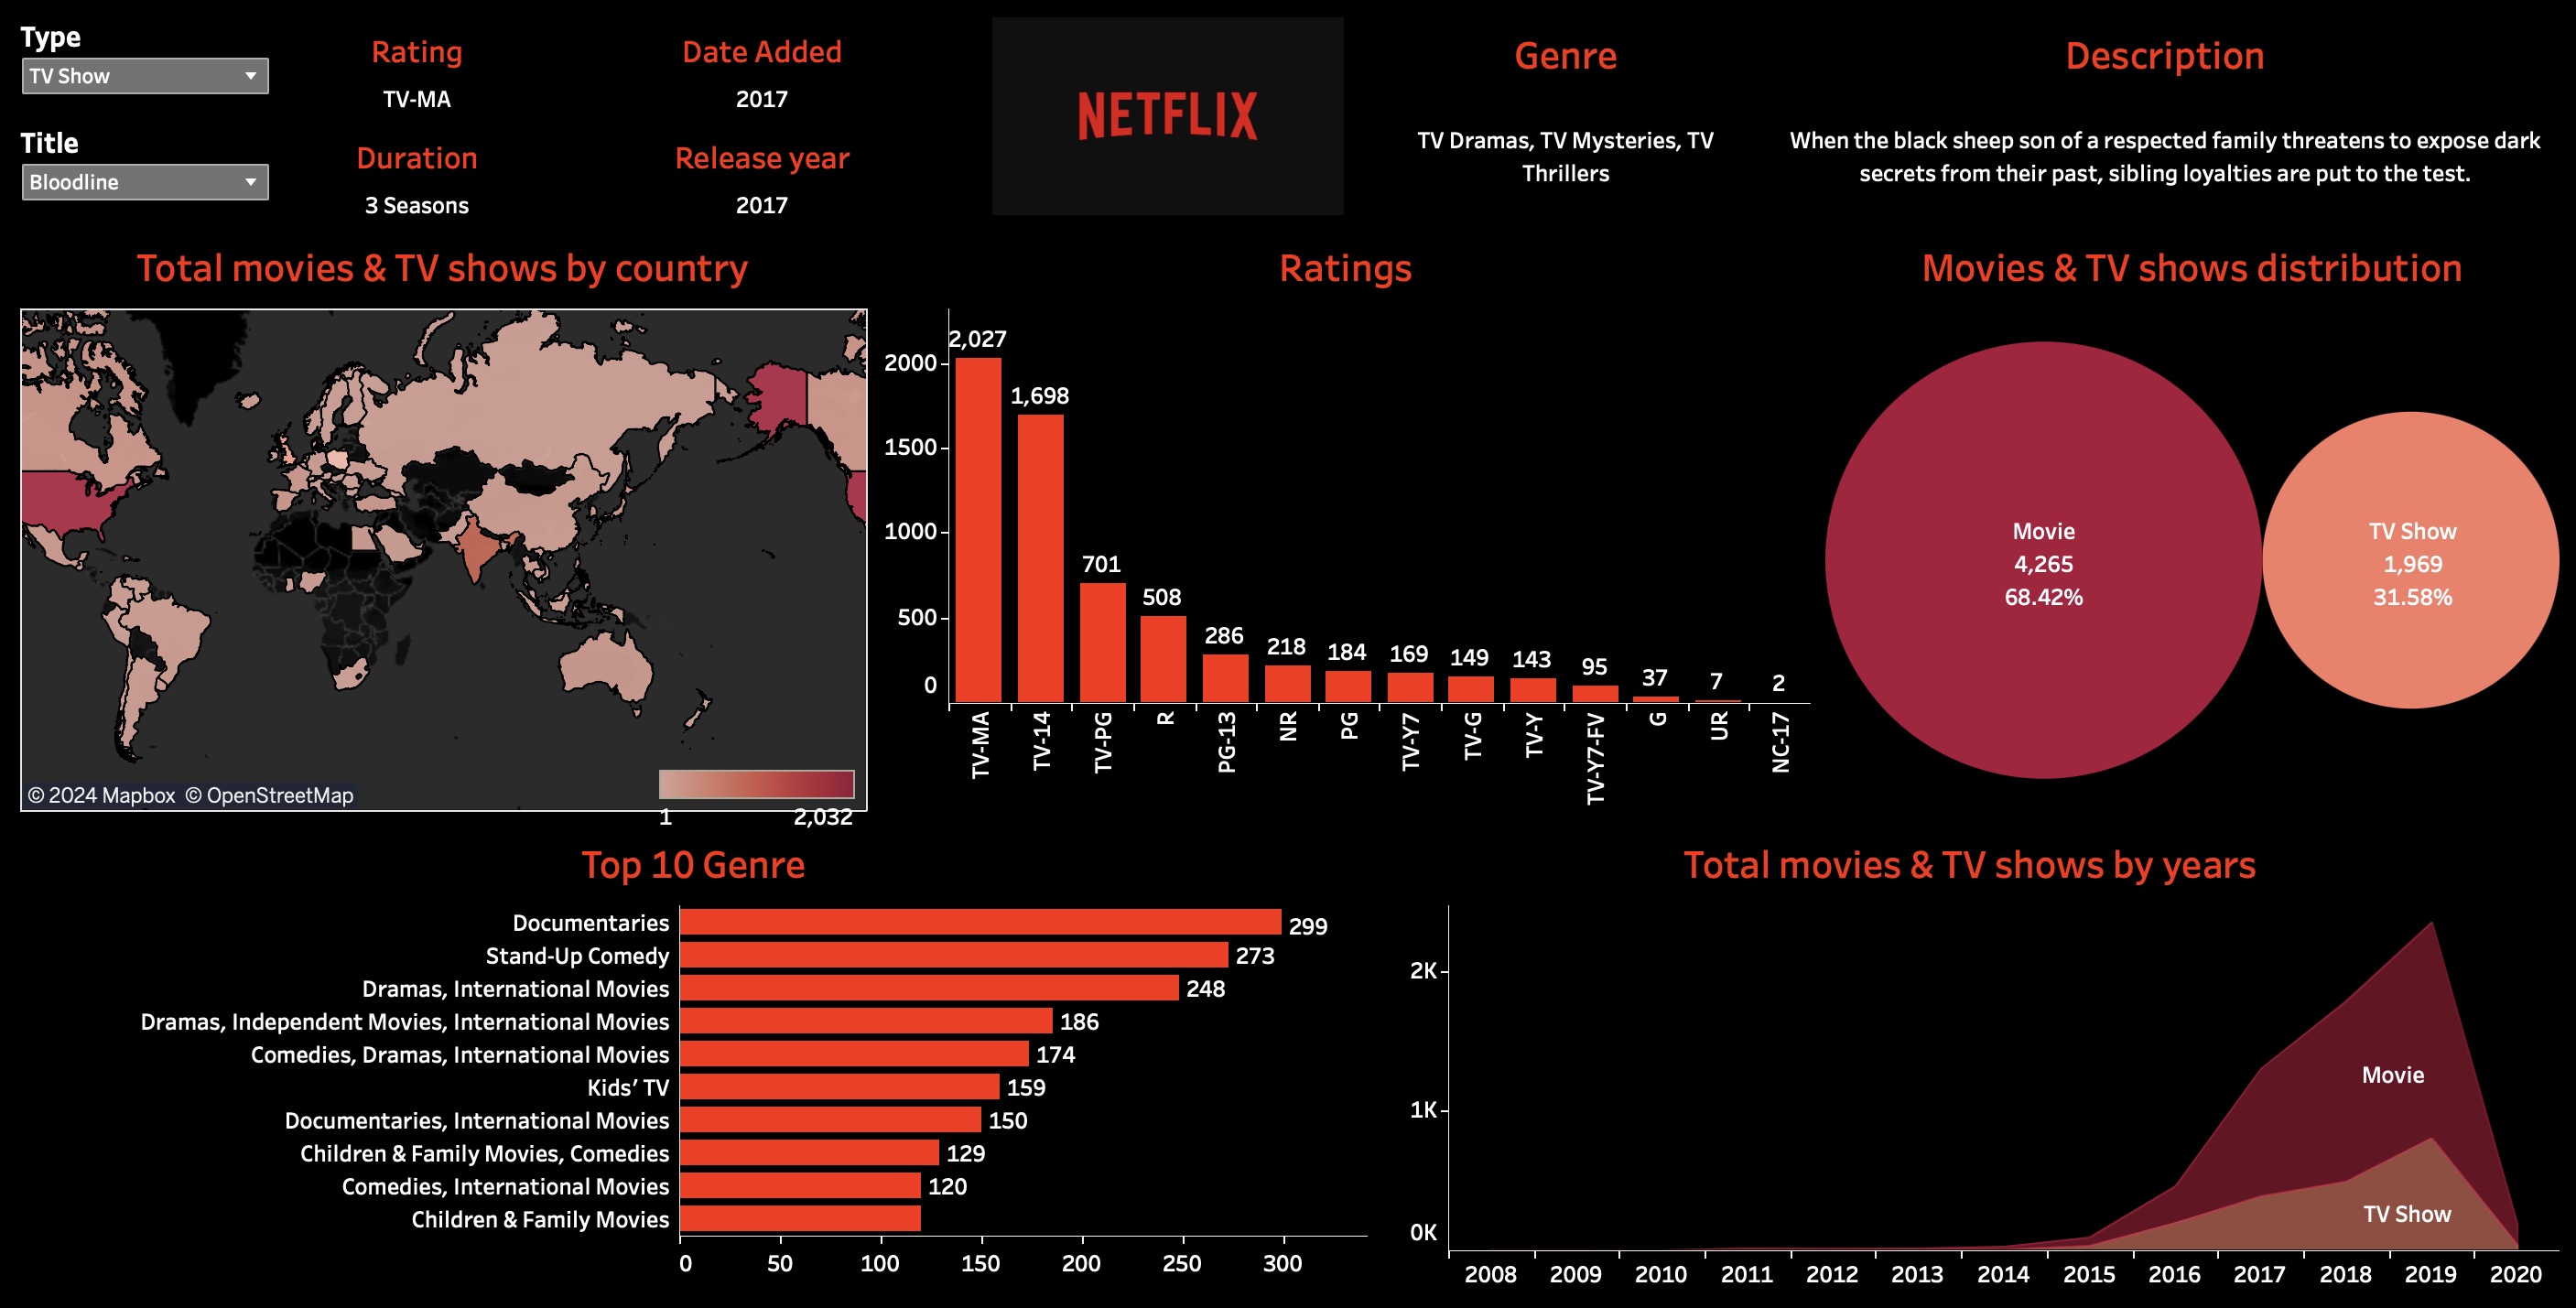
This project aims to conduct growth analysis on Netflix, delving into data on total TV shows and movies categorized by country, year, genre and many more.
The analysis provides insights into the platform's evolving content landscape and expansion dynamics.
An interactive dashboard backed by 10,000 movies and TV shows. It efficiently filters key data—ratings, duration, genre, release date, and date added—providing comprehensive details for informed viewing decisions.
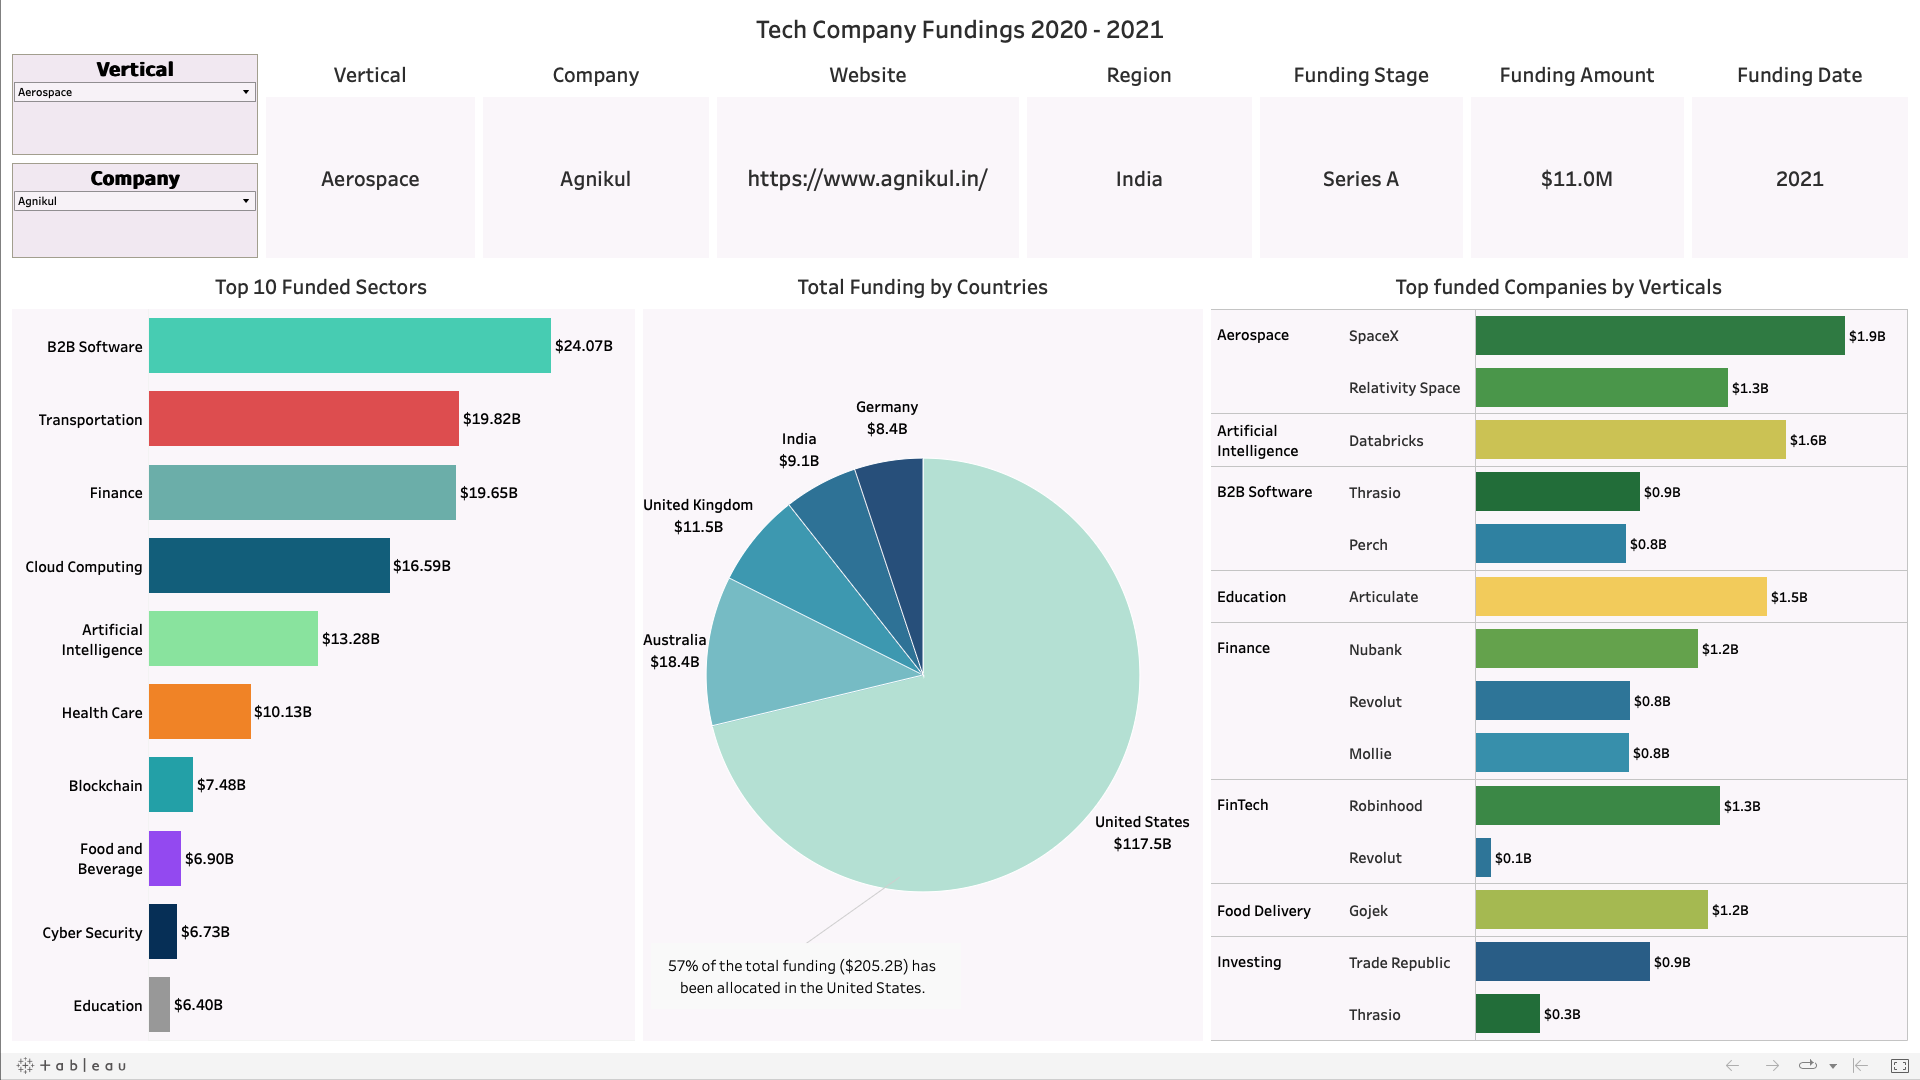
💰 Global venture investment in 2021 totaled $643 billion, compared to $335 billion for 2020, reflecting a 92 percent year-over-year growth 📈. The dashboard details verticals, regions, funding amounts, stages, and dates for specific companies.
It enables direct access to each company's webpage via provided URLs.
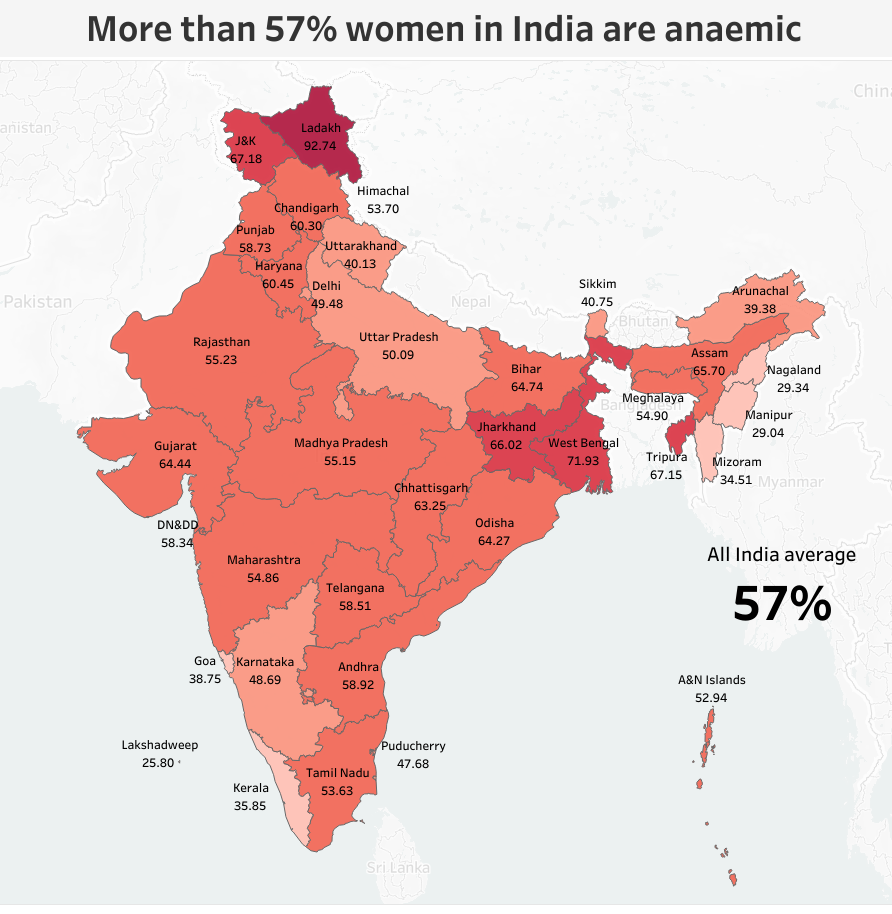
This project analyzes the health survey released by the National Family Health Survey (NFHS), 2019-21. The data indicate that more than 57% of women in India are anemic,
and more than 18.7% of men above the age of 15 consume alcohol. Additionally, the dashboard delves into district-level statistics.

Donec eget ex magna. Interdum et malesuada fames ac ante ipsum primis in faucibus. Pellentesque venenatis dolor imperdiet dolor mattis sagittis magna etiam.

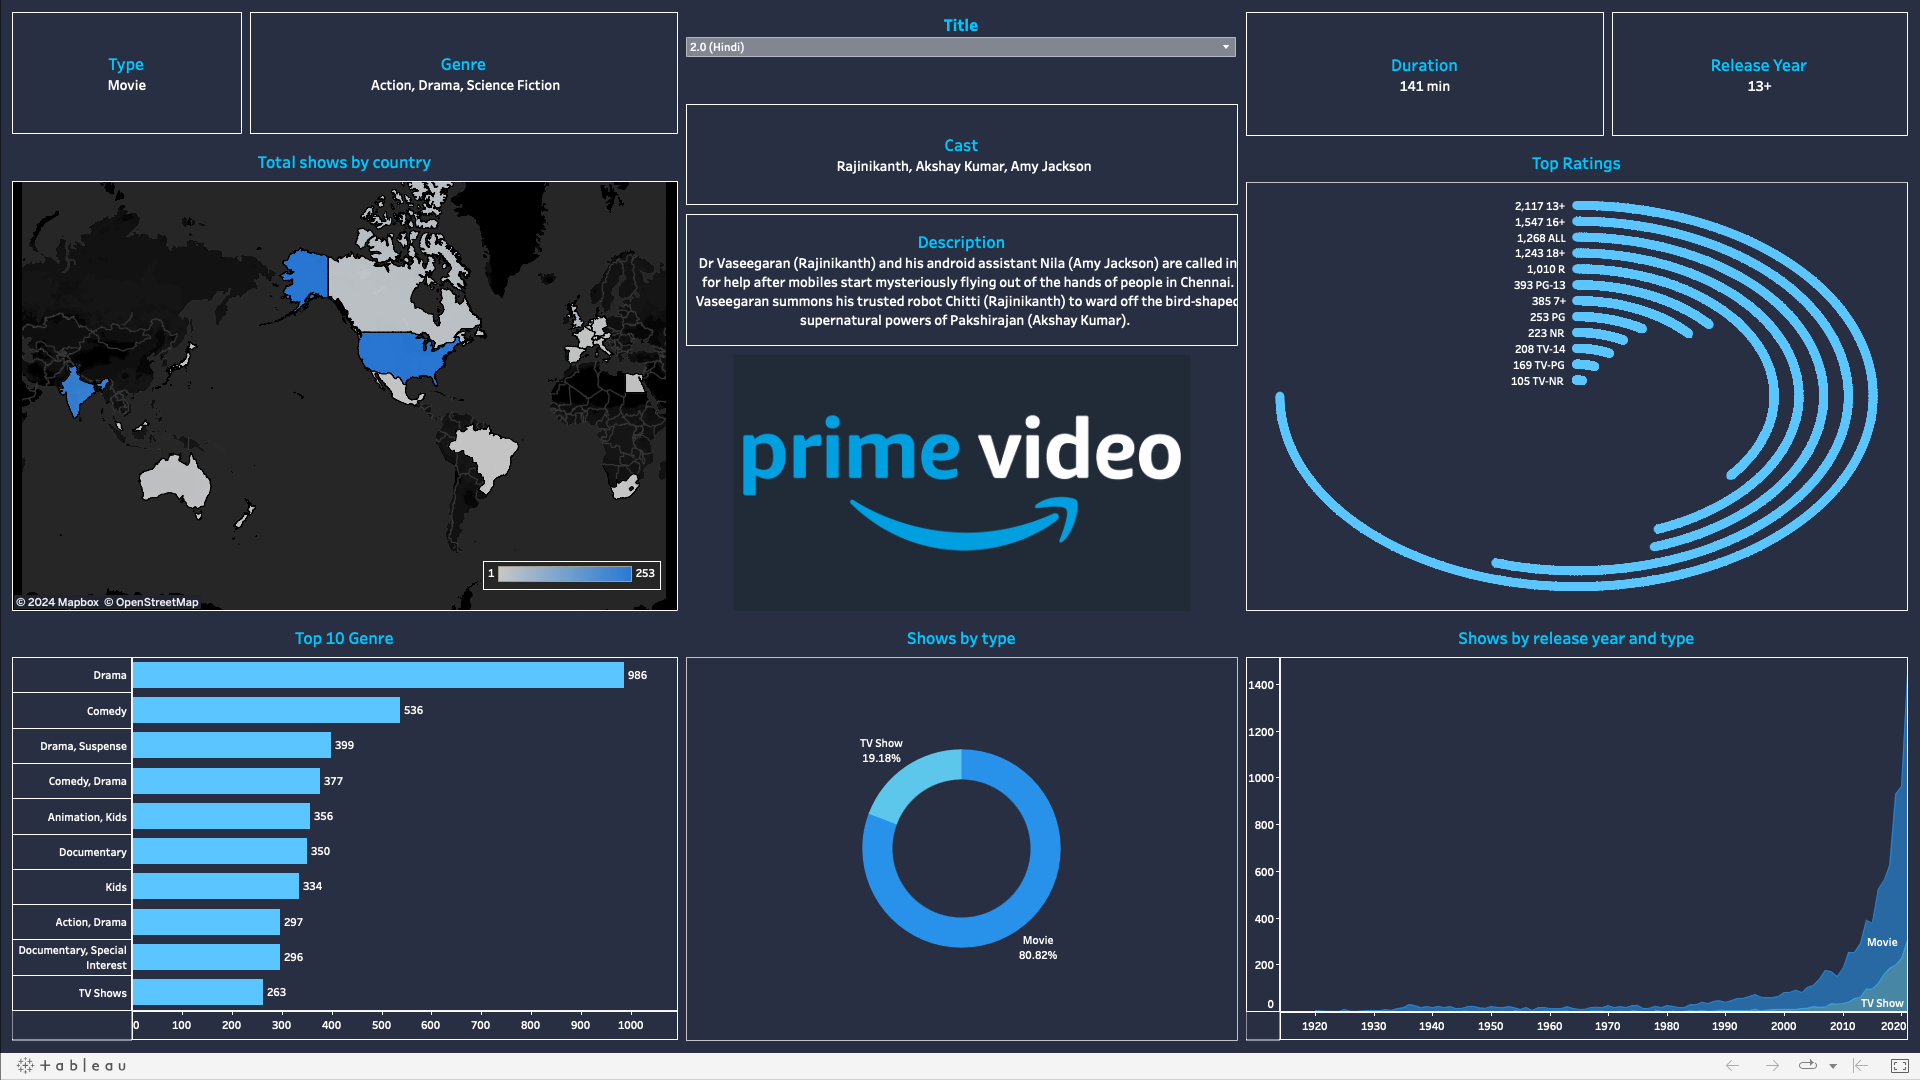
This project successfully extracts valuable data on Netflix shows and movies using Python. Which includes comprehensive information on content,
genres, cast, and more. It can be goldmine for data analysts, enabling in-depth insights into user preferences, content trends, and regional variations.